Casper for Raters: Data visualization
In 2020 Altus Assessments was finally ready to give their rating app some much-needed love. The fact is the app was not engaging and the Raters, as a user group had been more or less ignored.
The problem(s).
Raters, vital to the success of Altus Assessments were given feedback through a non-personal email as to how they were performing at their job
They constantly received emails from Altus, notifying them of test dates, and performance.
The current state of affairs.
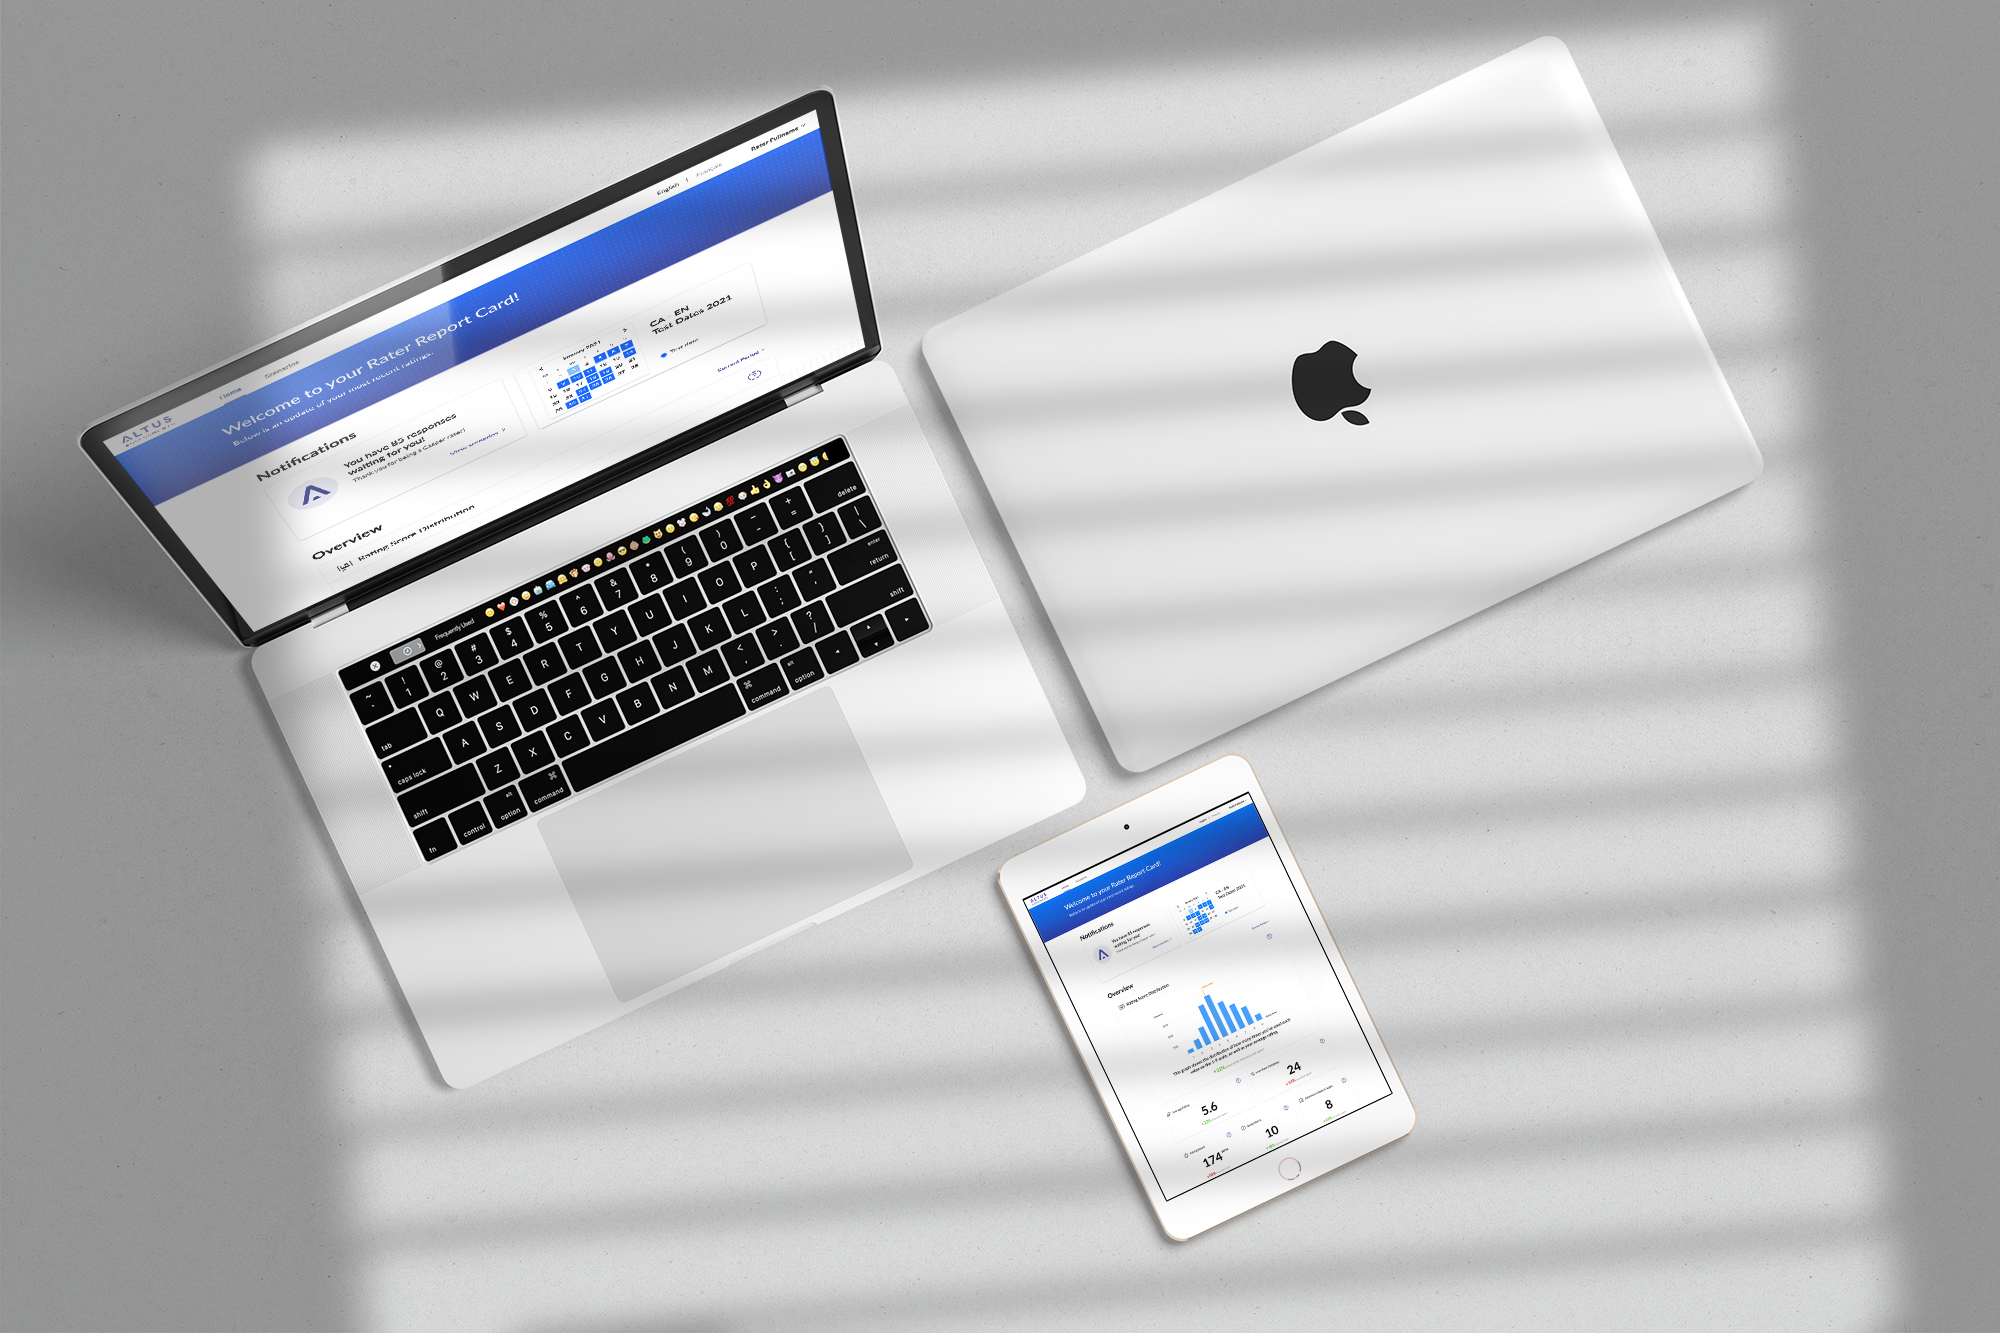
Raters were given an email that contained the below PDF. It is referred to as the Inter-Rater Report Card. The fact is that many Raters never even opened up this email or engaged with it much, if at all. The other image is the homepage for Raters. This is all they were ever given as a homepage. The product had been ignored for years


Goals.
Reduce the number of emails we send to the user.
Update design to help ensure confidence and credibility in the product.
Give the Raters something they would want to engage with.
Provide feedback to users that they will actually read and interact with.
Get to know the users:
Raters are 65% female and 35%, male.
32% American.
29% Australian and Canadian.
4% are in the Ukraine. 6% other.
Operating systems:
Windows - 40%.
Macintosh - 25%
Usability testing.
I tested 2 iterations before deciding on the final version. Below is a summary of the key points that came out of my usability tests. The project was rushed so as you see, after some initial sketches, I went into high fidelity right away.

Iteration 1.
Key findings & recommendation.
The new design was well-received, however, a couple of issues did come up in testing and after showing it to stakeholders. The biggest issue being the main banner was not accessible, not even close. The other issue is that many thought it was too colourful and lacked focus.
Iteration 2.
Key findings & recommendation.
Here I addressed the issues of accessibility on the top banner. However, I did fail to address the issue of clarity and focus. Through testing I was able to determine that again, I used far too many colours and alignments. The design still lacked focus. The last thing to come up was the need for a calendar, where the Raters could see when the next tests were coming up. Altus to communicate this with them would send emails, every time there was a new test to rate. Which in our busy periods, could be a lot of tests, therefore tons of emails.
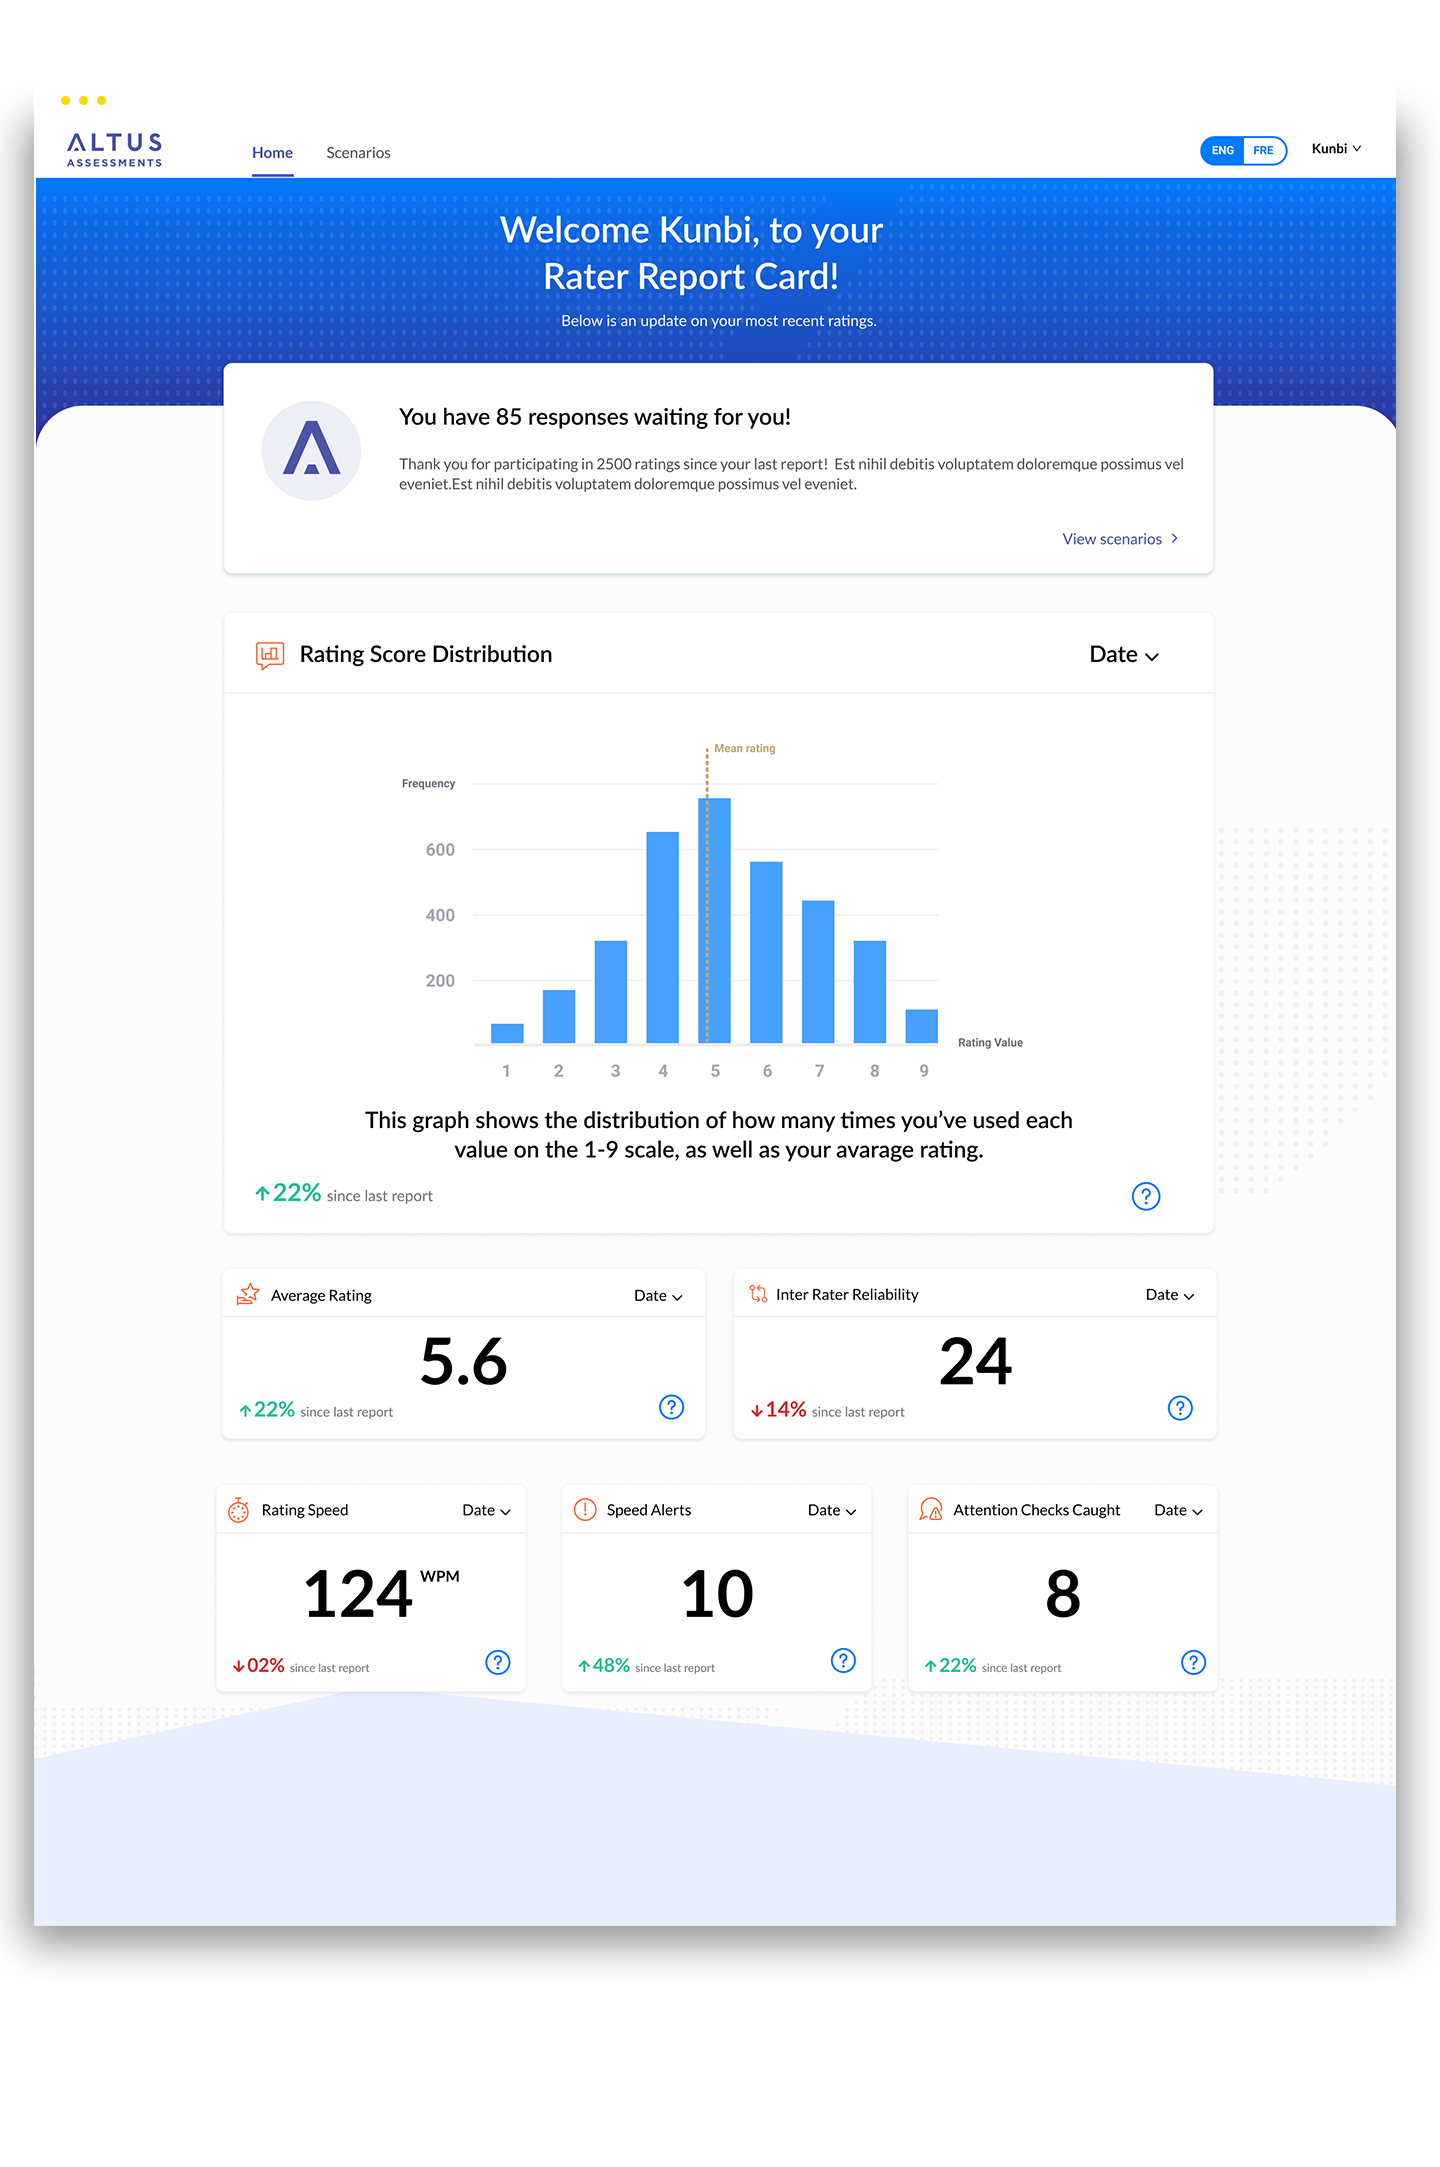
The final design.
After weeks of research and testing, this is where the final design landed.
A modernized design
More focus than previous iterations
The addition of a calendar
A proper explanation as to what each metric is
